Hanna Morris/Unsplash
There are many different ways to use diagrams in your business presentations. In fact, diagrams can be an extremely effective way to get your point across and to help your audience understand your ideas. Here are eight of the most common ways to use diagrams in business presentations:
- Project Timeline.
Using a timeline in your business presentation can help show the chronological order of your main points. Additionally, you can use milestones to represent key events that have occurred or will occur, while arrows between the milestones can show how one event leads to another. Timelines are especially useful when discussing new products being developed by a business or when discussing a project that is currently in motion.
- Cause and Effect.
A cause and effect diagram can be used to show the direct relationship between two different ideas, behaviors, products, etc. A common example of this would be using a Venn diagram to show how social media affects teenagers’ psychological well-being or how certain types of food affect the environment.
- Flowchart.
Flowcharts are extremely useful because they can help your audience understand complex processes with many different steps, especially if they aren’t always linear. For example, you could create a flowchart to show how employees are trained, recruited, assigned tasks, etc., in your business.
- Gantt Chart.
A Gantt chart can be extremely useful when you are trying to plan out the different tasks that need to occur within a certain timeframe. For example, if you are planning an office renovation project, you could create a Gantt chart to show how different phases of the project will be finished at certain times.
- Organizational Chart.
An organizational chart can help show how different people in an office or company fit in and connect with one another. This is helpful in a business presentation because it can help your audience understand who does what and who reports to whom, especially when you are discussing complicated job roles and responsibilities.
- Flowchart to Organizational Chart.
This type of diagram can be extremely useful if your business presentation includes a lot of organizational changes or restructuring. You could create a flowchart to show the different steps in your old office structure but then use an organizational chart to show how it has changed. This will help you have a clear, visual comparison between the two different structures before and after the changes occurred.
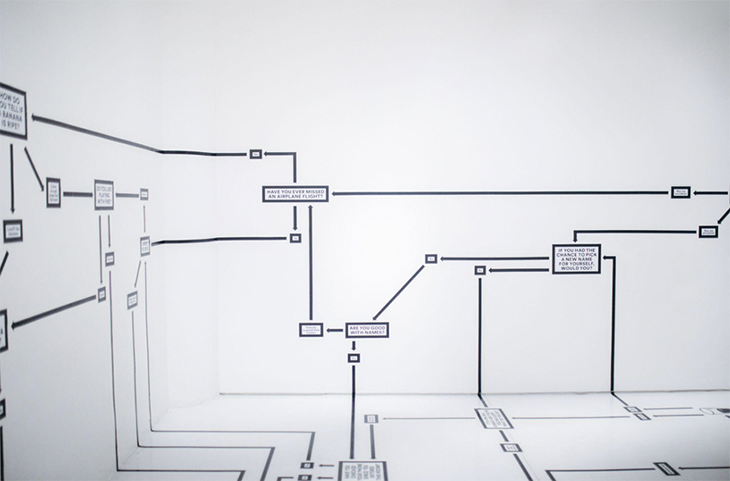
- Mind Map.
A mind map is a visual representation of your main idea or topic, with each word being linked to other words in a tree-like structure. The goal of a mind map is to show how ideas are interconnected and to show how one thought leads to another. Mind maps are particularly useful for putting your main idea or focus into a broader context.
- Comparison Diagram.
This type of diagram is helpful for comparing multiple ideas, products, behaviors, etc., in order to show their differences and/or similarities. A comparison diagram can be especially useful if you have some sort of point you want to get across that has different elements or variables. For example, if you were trying to explain the differences between gluten-free and vegan diets, it would be easier to show your audience these differences visually with a comparison diagram.
One great way to make diagrams is to use Venngage — an online diagram maker that offers various diagram templates for everyone. To give you an idea, here are some diagram examples from their website!
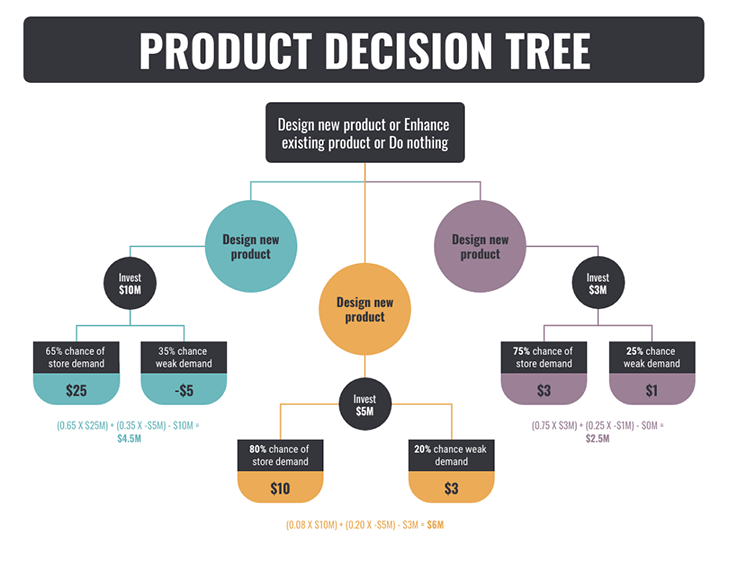
Venngage
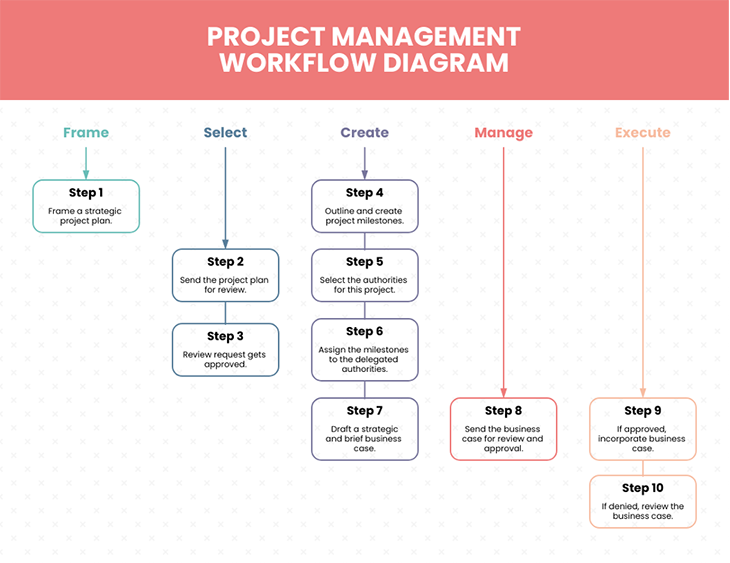
Venngage
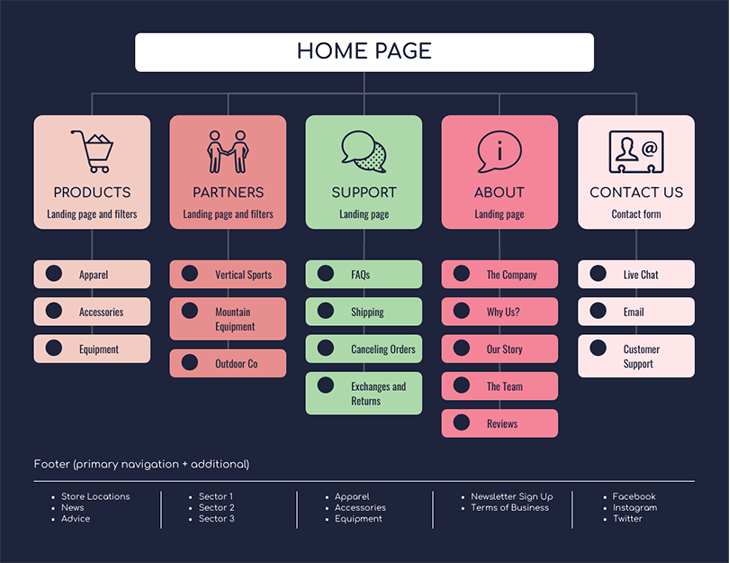
Venngage
Visual diagrams can be extremely helpful when you are giving a business presentation. They allow your audience to understand the information you are trying to get across in a more engaging and visual manner, which ultimately helps them retain the information you want to convey. Visuals help break up the monotony and keep your audience interested, especially during long presentations that may have a lot of data and information to present. If you’re ready to make your own diagrams today, click here!